Download a PDF version of the letter here.
“You can’t stop the waves, but you can learn to surf.”
~ Jon Kabat-Zinn
A swell is a set of waves produced by wind that blows across the water’s surface typically a long distance away from shore. The size and length of the waves can be attributed to the speed and time of the wind responsible for creating them. For surfers, swells create waves with more definition and speed than the random waves created by local winds, thus making them more attractive to ride. Capital markets share similarities to swells as investors, much like surfers, must navigate different types of waves and determine which ones to catch.
The 2024 swell has three significant waves – The Fed, Flows, and Factors – and all have had a significant impact on markets.
Wave One: The Fed
Fed chair Jerome Powell and the Board lowered rates by 50bps in September after 11 hikes, turning the page on the second longest tightening cycle (31 months) since Alan Greenspan raised rates to 9.2% in 1989. While much speculation and conjecture regarding the level of rates has occurred over this cycle, one mantra continues to prove true: Don’t Fight the Fed.
With the Fed now in an easing cycle, a different wave should emerge. Consider the following:
- During the five interest rate easing cycles since 1984 where the economy did not quickly enter a recession, the S&P 500 returns over the following six and 12 months were both positive, with the latter averaging double-digit gains. (Goldman Sachs)
- Over the past 40 years, the Fed has cut rates 12 times when the S&P 500 is within 1% of all-time highs. The S&P 500 was higher a year later all 12 times with an average return of approximately 15% (JP Morgan).
- As of the writing of this letter, the market expects the Fed to lower rates by another ~50bps before year end. The FOMC median rate forecast for next year is at 3.3%, implying almost 100bps of cuts in 2025.
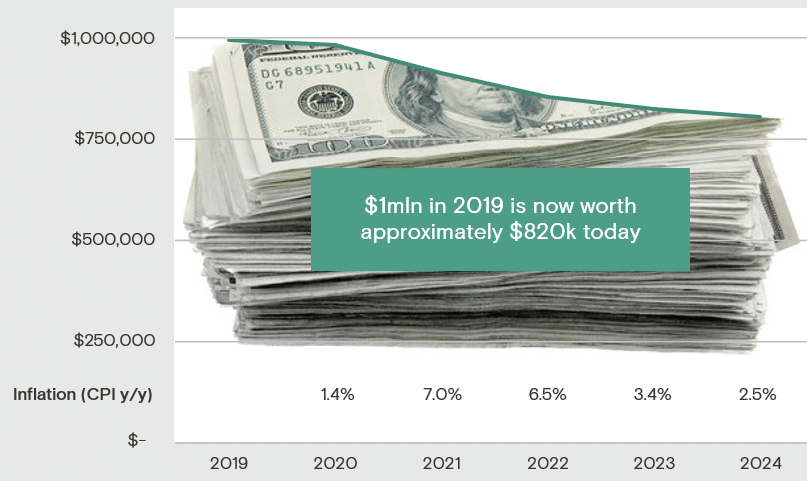
Coinciding with the Fed beginning an easing cycle, investors are pouring cash into money market funds (their yields will decline in tandem with interest rates). According to the Investment Company Institute, money market assets recently hit a record high of over $6.4 trillion – this is $2 trillion over the prior peak during the Great Financial Crisis. Significant wealth has rarely (maybe never) been created via cash management strategies. One should expect a wave of capital seeking positive real returns in risk assets as hiding in the US dollar over the past five years has been costly.
ILLUSTRATION 1
$1mln in Cash: The Cost of Inflation Over Past 5 Years

Source: Minneapolis Fed
Stan Druckenmiller famously said:
…focus on the central banks, and focus on the movement of liquidity…it’s liquidity that moves markets.
The Chinese stock market rallying 25% over the last five days of the quarter due to stimulus is a prime example of this. Waves created by the Fed and other central banks shouldn’t be ignored.
Wave Two: Money Flows
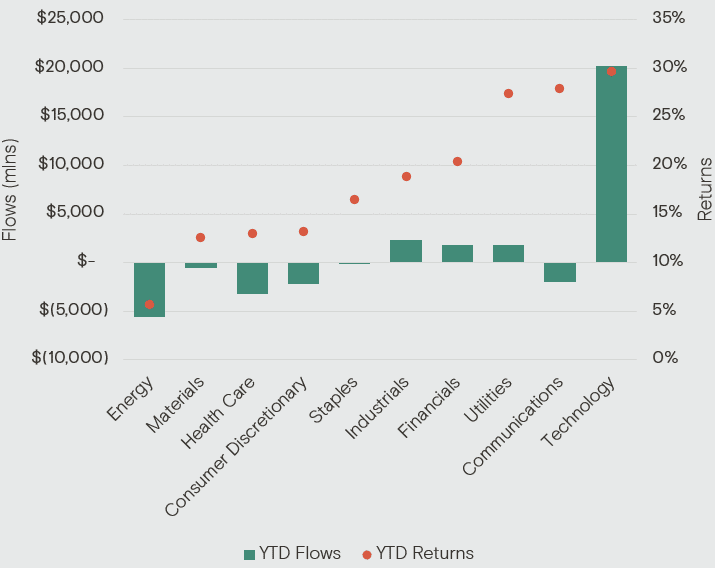
ETF (exchange traded fund) money flows are tracked by different sources and have become a very popular way for investors to gain exposure to sector trends. This is a wave worth noting as contemporaneous correlations of flows and performance prevail. The technology sector ETF flows year-to-date are now over $20bln, more than 8x the next highest sector (Industrials), and this is by far the best performing sector (Graph 1). The sector with the most outflows is energy (>$5bln), and it shouldn’t be surprising it is the worst performing sector year-to-date.
GRAPH 1
YTD Flows (mlns) & Returns by Sector ETF

Source: S&P Global, Bloomberg, J.P. Morgan, Nixon Capital
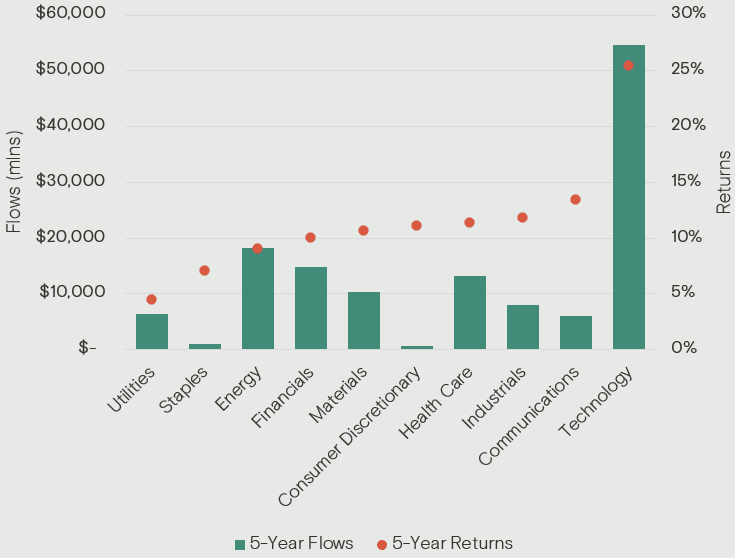
The technology sector has proven that the money flows wave is longer than others in this swell. The technology sector’s five-year inflows are over $54bln as seen in Graph 2. This amount is almost the equivalent to the inflows of the next four sectors combined (Energy, Financials, Health Care and Materials inflows total over $56bln).
While tech has the biggest inflows, the five-year return also annualizes at 25.5%, trouncing the next highest sector (Communications) by 1200bps per year! Six tech companies now account for over 25% of the total market capitalization, which is why we highlighted last quarter that index concentration must be monitored. Money flows and the concurrent returns represent the second wave impacting markets this year. Tech investors who have been able to ride it have benefited significantly.
GRAPH 2
5-Year Flows (mlns) & Returns by Sector ETF

Source: S&P Global, Bloomberg, J.P. Morgan, Nixon Capital
Wave Three: Factors
The last of the waves is attributed to factors, or measurements such as size, volatility, or dividends. The best performing stocks in 2024 exhibit the following factors:
- Momentum – these are securities with high relative performance. The year-to-date return for the S&P 500 momentum index is 39%.
- Growth – these are securities with sales and earnings growth, along with momentum. The year-to-date return for the S&P 500 growth index is 28.2%.
- Quality – these are securities with low leverage and high returns on equity. The year-to-date return for the S&P 500 quality index is 25.8%.
Securities with factors such as beta, value, and dividends would be referred to as a mush wave – one which lacks power and is not a desirable wave to be on. They are the worst performing factors while momentum, growth and quality factors represent the best, and are the last significant wave in this set.
The distribution of quality factor valuation premiums since 1980 highlights that prior to Fed cutting cycles, investors were not willing to pay a premium for quality factors. According to Goldman Sachs, the premiums investors are willing to pay today for quality factors like margins and returns sit at the highest levels over the last 40 years. This dovetails with the factor returns being the third wave, however it appears to be crowded with surfers.
Conclusion
Swells can change in direction and size, and part of our job is to recognize when these changes occur. While timing is always the most difficult aspect, we are continually on the lookout and willing to surf waves opportunistically.
The Nixon Capital Team
Any views expressed are subject to change at any time, and Nixon Capital disclaims any responsibility to update such views. Information contained herein has been obtained from various sources believed reliable but is not necessarily complete. Accuracy is not guaranteed. Any reliance placed on opinions and assumptions herein is done at your own risk. Nixon Capital has not reviewed any of the websites that may be linked to this letter and is not responsible for their content. Nixon Capital is not responsible for the privacy practices of such other websites. Discussions of individual securities are intended to inform shareholders as to the basis (in whole or in part) for previously made decisions by the firm to buy, sell or hold a security in a portfolio. References to specific securities are not intended and should not be relied upon as the basis for anyone to buy, sell or hold any security. Portfolio holdings and asset allocations may not be representative of the portfolio manager’s current or future investment and are subject to change at any time. This information is not to be reproduced or redistributed to any other person without the prior consent of Nixon Capital LLC.