Download a PDF version of the letter here.
“The truth is, whatever game you play in life…sometimes, you’re going to lose.”
~ Roger Federer
Considered by many to be the greatest tennis player of all time, Roger Federer recently delivered the commencement speech to the graduates of Dartmouth College. His speech can be found here and in it he shared three “tennis lessons” which apply to any endeavor:
- Effortless is a myth
- It’s only a point
- Life is bigger than the court
For the purposes of this letter, we are going to focus on lesson number two. As we wrap up the first half of the year, it is worth noting that a short time frame for long-term investors is only a point in a much longer match. However, we have missed some shots and thus lost some points this year.
Federer mentions in his lesson that “perfection is impossible” in tennis – you don’t have to win every point to win a game. This is like investing, where winning an above-average number of points can lead to long-term compounding. Federer proves this:
In the 1,526 singles matches I played in my career, I won almost 80% of those matches…Now, I have a question for all of you…what percentage of the POINTS do you think I won in those matches?
Only 54%.
In other words, even top-ranked tennis players win barely more than half the points they play.
It is a mind-blowing statistic to consider when you look at his career achievements:
- 103 singles titles: This is the second most of all-time (Jimmy Connors won 109)
- 20 major men’s singles titles: He won a record eight times at Wimbledon as well a joint-record five times at the US Open
- Record consecutive weeks as No. 1 player: He was ranked atop the world for a record 237 consecutive weeks and for 310 weeks total
Federer’s career had thousands of lost points which sometimes led to even bigger losses. He mentions one of his bigger losses to another tennis legend, Rafael Nadal, as they played each other 40 times over the course of their careers. Nadal won 24 of those matches, which must have been some inspiration for Federer to mention this:
The best in the world are not the best because they win every point…it’s because they know they’ll lose…again and again…and have learned to deal with it.
Federer’s lesson is a reminder that losses are ordinary occurrences in any competition. Even more important is the attitude and temperance needed to endure periods of lost points to enable winning sets and matches. We can relate.
Review of 1H 2024
To continue with the tennis analogy, our investment portfolio has felt like we are stuck at “deuce” this year. Points won are followed up with missed shots, and there are a couple of reasons for this:
- Portfolio winners from 2023 have been losers to start 2024. Some of these price moves are warranted as the fundamentals needed to play catch up with valuation. Seven of the investments in your portfolio that fit this category have an average decline of 12% YTD.
- Other portfolio companies have reset their sales and earnings growth rates as the lag effect of higher rates lowered demand. We surmise 2024 will prove to be a trough year for roughly six of our investments – these companies have interest rate sensitive business models whose fundamentals should improve with stable/lower interest rates.
We acknowledge our performance in the short run is a lost point, but the portfolio consists of investments that we anticipate will win us games and sets. The attractive attributes of our portfolio (stats are weighted averages) position us to generate competitive returns:
- P/E of 13.5x 2025 estimates
- Dividend yield of 2.12%
- Estimated annual sales growth of >5% through 2025
- Estimated annual EPS growth of >14% through 2025
- Avg maturity date for debt is 12/31/2028
The portfolio is positioned to successfully navigate a variety of outcomes as it relates to interest rates, the U.S. election, or any significant economic slowdown created by unknown factors. While downside protection is our primary focus, the portfolio return profile using our estimates of intrinsic value is extremely attractive today for investors with adequate time horizons.
Nixon Capital vs. S&P 500 Index
We are opportunistic, value investors and agnostic to market capitalizations, sector weights, or growth/value styles. However, we benchmark to the S&P 500 index as it covers “approximately 80% of the available market capitalization” and is a gauge of the U.S. equity market (this index is market-cap weighted meaning the bigger a company gets, the larger the weight it has in the index). Neither we nor you, as our investors, concern ourselves with relative returns that aren’t attractive on an absolute basis. We chose this index as it is the most difficult competition to benchmark against, which is supported by this statistic: According to S&P Global, since 2001, 93% of the active U.S. large-cap funds have underperformed this benchmark through the end of last year. To compare, attribution of our returns versus the Russell 1000 Value Index highlights not only our outperformance since inception, but that we rank in the 7th percentile versus all peers through 2023.
The active (Nixon Capital) versus passive (S&P 500) investment debate is a consistent topic we get asked about: Why shouldn’t I just invest in the S&P 500 index versus invest with you? It is a great question but without a simple answer.
Both Nixon Capital and the S&P 500 are portfolios that invest in public equities, but they are extremely different. It is like asking whether you want to own the Dallas Cowboys or the Houston Texans – both are football teams but with very different characteristics, personnel, and win/loss records.
The concept of “active share” is a way to measure the difference between a portfolio’s holdings and the benchmark index they compare to. An active share of 0% would mean the portfolio is exactly like the benchmark, while an active share of 100% means the portfolio holds no positions in the benchmark. Our active share currently sits at 99.4%. This measurement is not only a function of our philosophy which has led us to opportunities we believe are attractive outside the index, but also how the S&P 500 has evolved significantly in the past five years.
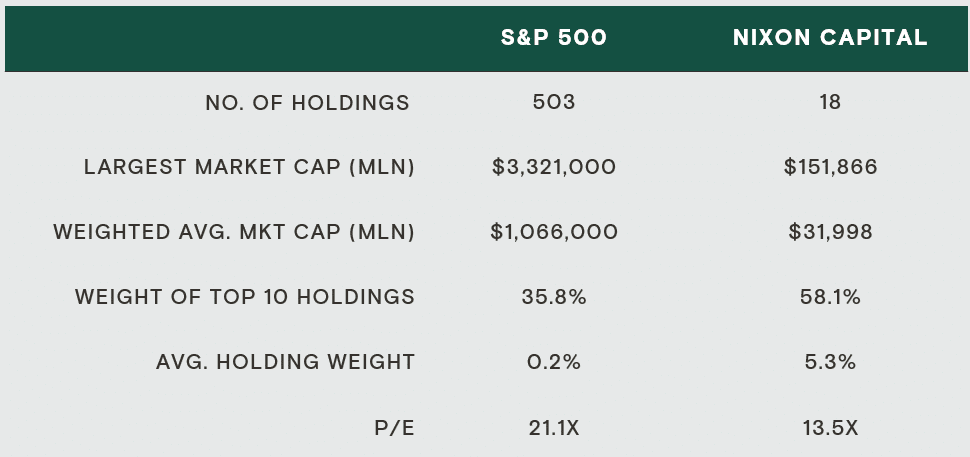
Active share measures holding differences, but there are other portfolio characteristics worth comparing, which we have done below:
TABLE 1
Nixon Capital vs. S&P 500 Comparison, As of 6/30/2024
Source: S&P Global, Bloomberg, J.P. Morgan, Nixon Capital
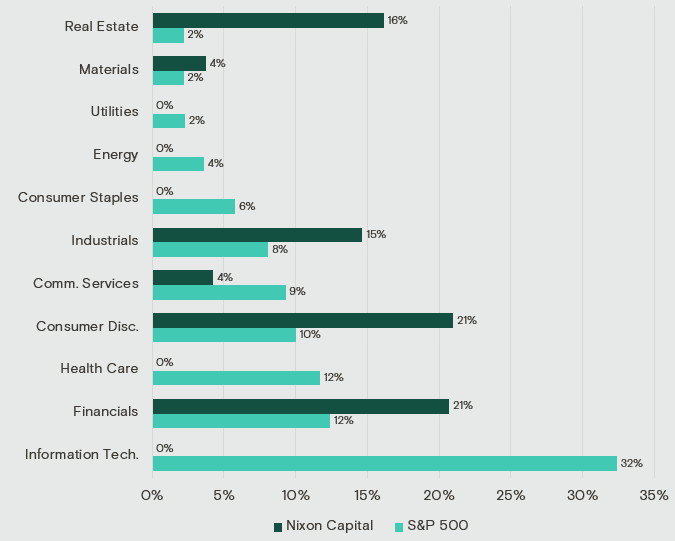
As one can observe, the differences between the two equity portfolios are stark. Why are we so different? It makes zero sense for us to construct a portfolio that replicates or is very similar to an existing one that any investor can access. We have also witnessed that owning a factor-based portfolio utilizing size, momentum, or valuation multiples can work well over certain periods, but can also fall quickly out of favor. We apply our value-oriented philosophy to construct a portfolio that is opportunistic and all-weather – seeking to achieve attractive absolute returns regardless of factor or environment.
CHART 1
Nixon Capital vs. S&P 500 Sector Weights, As of 06/30/24
Source: S&P Global, Nixon Capital
S&P 500 Index Concentration and Performance
The largest company (Nvidia) in the S&P 500 is almost 7x larger than our entire set of holdings. The total market capitalization of our portfolio is roughly the size of the 18th largest position in the S&P 500. These size comparisons are staggering and the result of the S&P 500 index evolving into a concentrated, momentum-driven, mega-capitalization portfolio of technology companies. We are also concentrated, but our largest holdings are not a thematic bet (AI in the index) – transportation, real estate, media, fintech…all concentrated positions but with very differentiated risk profiles. While the index has experienced this sort of concentration in the past, a 37% weight for the top 10 holdings surpasses the Internet Boom of the 90’s and Big Oil of the 70’s by a wide margin. Indexed capital, believing they own a broad set of companies across different sectors, should not ignore this as it will undoubtedly impact future returns.
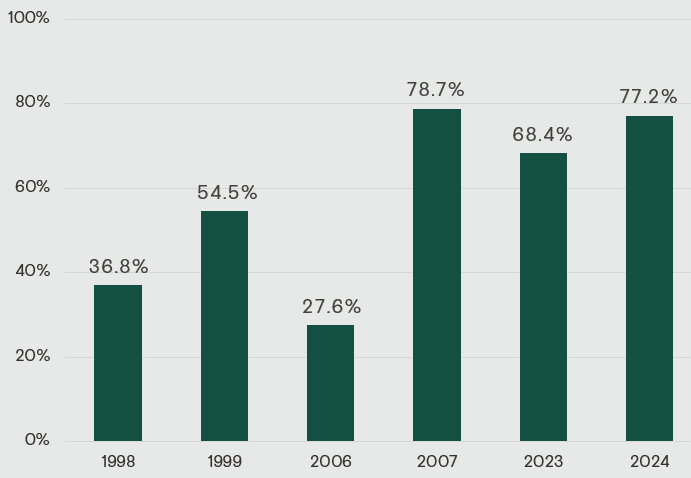
CHART 2
Annual S&P 500 Contribution of 10 Largest Weights During Positive Performance Years
Top 10 as a % of Total
Source: Strategas, Bloomberg, 7/1/24
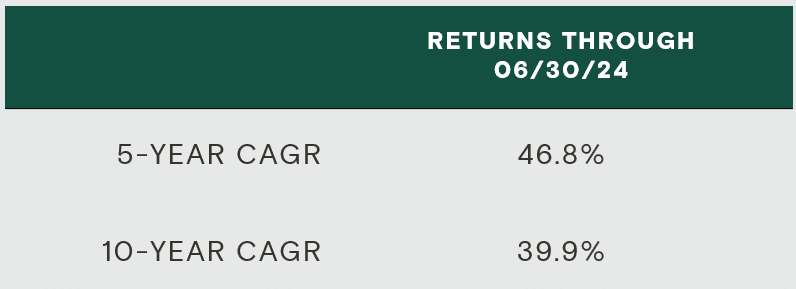
As a market-cap-weighted index, the compounding effect of outperformance by the larger holdings becomes noteworthy to the overall performance. In 2023, the Magnificent 7 (Mag7) stocks returned 76%, while the remaining stocks in the S&P 500 returned 8%, according to J.P. Morgan. This year is similar as the Mag7 have appreciated 33% vs. 5% for the remaining 493 companies. The contribution of these large holdings to the S&P 500 return is over 60% for the past two years (CHART 2), but continued performance contribution has not proven sustainable. In fact, according to Counterpoint Global, since 1950 “just 11 stocks have spent more than two years in a spot among the top 3.”
The contribution to the return has been driven by the continually impressive stock price performance of only seven companies:
TABLE 2
MAG7 Index Total Return
Source: BM7T Index Bloomberg Holdings: META, AAPL, NVDA, MSFT, AMZN, GOOGL, TSLA
According to Bloomberg, the three-month correlation between the S&P 500 and the number of stocks advancing is currently below the low set during the year 2000. While the Mag7 stocks have soared, the remaining companies in the index have not. Not since 1980 has there been a record-low percentage of stocks outperforming the S&P 500 (CHART 3).
Outside the Mag7, the rest of the S&P 500 has become somewhat irrelevant for each company’s price performance and the influence on the index return. Consider this, for every $100 that is indexed to the S&P 500, over $31 is allocated to ~425 different companies whose position size is 25 basis points (bps) or less in the index. One of our investments, which happens to be one of the smallest positions in the index, is a 2.5 bps position. The company would have to grow roughly 7.5x the size it is today to break into the top 100 positions, whose market capitalizations are over $100bln. This meteoric rise would contribute a minuscule 16.5 bps of total return to the index, rendering this 30-year-old, $12bln industry leader unnoticeable as it relates to return contribution.
CHART 3
Record-low Percentage of Stocks Outperforming the S&P 500 Index
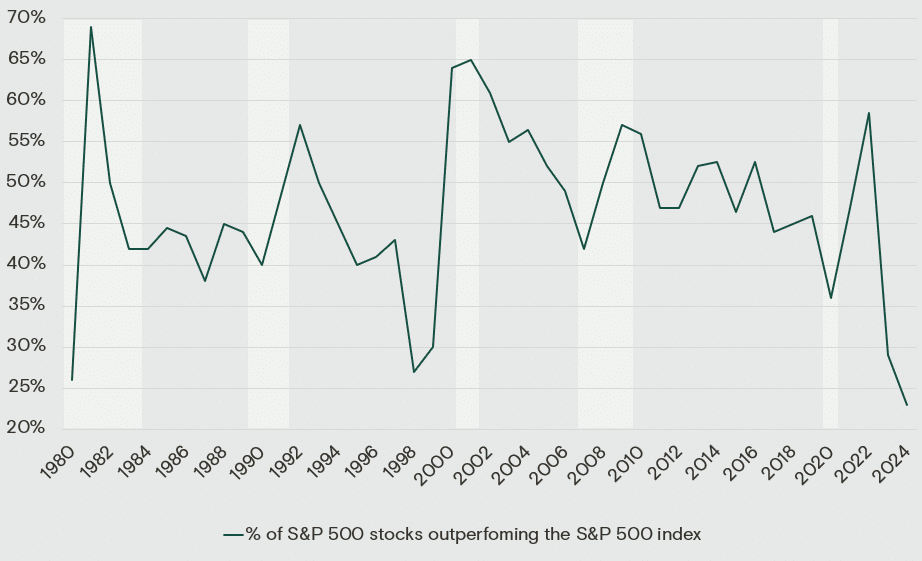
Source: Bloomberg, Apollo Chief Economist Note: Annual data is from January 1 to December 31 for each year. The 2024 data is as of July 2, 2024 (year-to-date).
S&P 500 Equal Weight Comparison
The S&P 500 equal-weighted index addresses the market capitalization factor as the index assigns each company the same weight. Some might argue this is a better representative of how “the market” is performing. This index has underperformed the weighted index by over 400 bps per year for the last five years. In the second quarter alone, the equal-weighted index underperformed the S&P 500 by almost 7%, making it the third-highest underperformance spread in 34 years. Whether one believes in mean reversion or not, history would show there is a “catch up rally” that takes place after this massive divergence. CHART 4 illustrates the historical pattern that emerges following periods of significant outperformance/underperformance by the respective indices.
CHART 4
S&P 500 Market Cap vs. Equal Weight Performance
Rolling Monthly Y/Y Total Returns
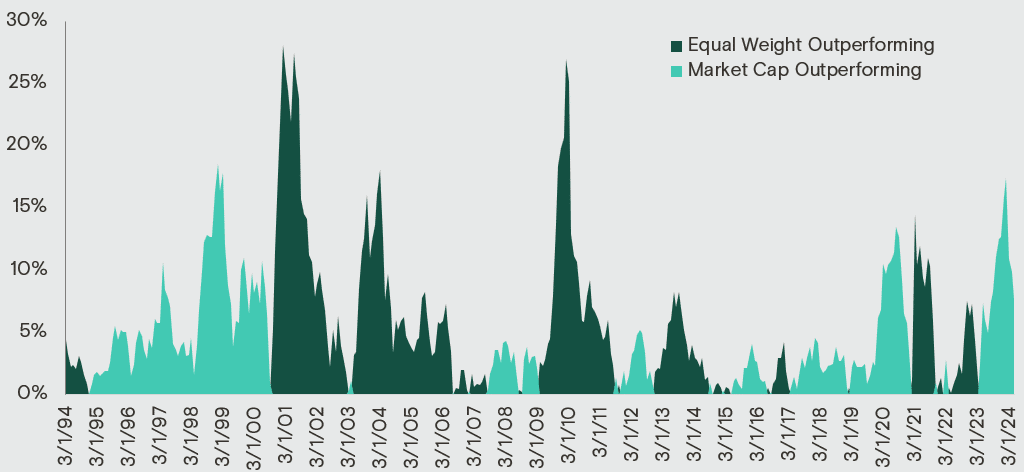
Source: FactSet, J.P. Morgan Asset Management, Guide to the Markets – U.S. Data are as of May 31, 2024
Other S&P 500 Data Points to Consider
As it relates to making an investment in the S&P 500 index today, one must also consider the following data1:
- The rolling 5-year return is at the third highest level in 24 years
- The top 10 positions sell for 30.3x earnings, which is 148% of the average since 1996. The remaining positions trade for 17.6x.
- Historical data confirms when the S&P 500 has traded with a P/E over 20x (where it is today), the subsequent 5-year annualized return is well below average.
- The value versus growth relative P/E valuation is now at 0.54, well below the average of 0.71 since 1997.
- High growth stocks (the biggest concentration in the index) are valued at the 97th percentile relative to low growth stocks since 1980 according to Goldman Sachs.
- The smallest market caps in the index are trading at the lowest relative P/E to the largest names since 1999 according to Bank of America.
Conclusion: Answering the Question
Let’s revisit the Federer vs. Nadal rivalry – if you had to pick one, who do you choose? Together, they won 42 grand slam titles and are the only two men to have finished ranked in the top two for six years from 2005-2010. On clay, Nadal led 14-2, while on grass Federer led 3-1 and he also led on hard courts 11-9. So again, who do you want on your team? It depends.
Why shouldn’t I just invest in the S&P 500 index versus investing with Nixon? It depends. No one can predict what trends/factors will continue to outperform and for how long. As the small print says, “past performance is no guarantee of future results.” The allocation decision to invest in public equities doesn’t necessarily have to be either/or as it relates to active (Nixon) versus passive (S&P 500 Index), but comparisons must be made, and historical attribution analyzed. The S&P 500 might continue this run but it will have to be tech stocks leading the way given the construction of the index. At some point in this cycle, history might rhyme, and the S&P 500 will not generate a competitive return. As Empirical Research highlighted, “In subsequent years (after 1999 and 2007)…undervalued issues usually led, by somewhat more than usual, with low-P/E stocks in the lead.”
Our track record since inception has both periods of outperformance and underperformance relative to the S&P 500. As it stands today on a three-year rolling return basis, our performance spread versus the index is at the worst it has ever been, largely driven by the past six months. However, reversions have rewarded us and our investors in the past. We must endure periods of lost points, but embrace and emulate Federer’s discipline to win in the long run:
When you’re playing a point, it is the most important thing in the world.
But when it’s behind you, it’s behind you…This mindset is really crucial, because it frees you to fully commit to the next point…and the next one after that…with intensity, clarity and focus.
The Nixon Capital Team
Any views expressed are subject to change at any time, and Nixon Capital disclaims any responsibility to update such views. Information contained herein has been obtained from various sources believed reliable but is not necessarily complete. Accuracy is not guaranteed. Any reliance placed on opinions and assumptions herein is done at your own risk. Nixon Capital has not reviewed any of the websites that may be linked to this letter and is not responsible for their content. Nixon Capital is not responsible for the privacy practices of such other websites. Discussions of individual securities are intended to inform shareholders as to the basis (in whole or in part) for previously made decisions by the firm to buy, sell or hold a security in a portfolio. References to specific securities are not intended and should not be relied upon as the basis for anyone to buy, sell or hold any security. Portfolio holdings and asset allocations may not be representative of the portfolio manager’s current or future investment and are subject to change at any time. This information is not to be reproduced or redistributed to any other person without the prior consent of Nixon Capital LLC.